Reporting
for
Square


about Spencer Martin
The clear choice for design
2023
In my role at Square, I spearheaded a transformative reporting project that seamlessly merged two critical components: the creation of a comprehensive design system and leadership in pioneering user experience research (UXR). As the lead, I orchestrated the development of a robust design system, meticulously crafting reusable components and design patterns to ensure consistency and efficiency across our reporting platform. Simultaneously, I took charge of driving cutting-edge UXR initiatives, delving deep into user behaviors and preferences to inform the design process.Through meticulous collaboration with cross-functional teams, I facilitated the seamless integration of design principles and user insights, resulting in a reporting platform that not only boasted a visually cohesive and intuitive interface but also prioritized user-centric functionality. By championing both the development of a full-fledged design system and spearheading innovative UXR methodologies, I played a pivotal role in shaping Square's reporting ecosystem into a pinnacle of design excellence and user satisfaction.
In our ambitious project, we embarked on a mission to satisfy not one, not two, but nine distinct archetypes, each with their own unique needs and preferences. From the visionary trailblazers craving innovation to the meticulous traditionalists seeking reliability, and everyone in between, our challenge was to create a solution that resonated deeply with each archetype.
Our platform wasn't just a solution; it was a dynamic ecosystem empowering not just one, but five distinct teams to achieve their goals with precision and efficiency. As the backbone of their operations, our platform seamlessly integrated into the workflows of each team, providing tailored tools and functionalities to meet their specific needs.
Our platform was built with scalability at its core, designed to cater seamlessly to the needs of sellers ranging from large enterprises to small businesses. As the backbone of e-commerce operations, our platform underwent a transformative journey, evolving to accommodate the diverse needs and scale of sellers across the spectrum.
Crafting a relatable matrix was key to getting other teams onboard with the scale of our project. By distilling complex concepts into a visual framework, we provided teams across the organization with a clear roadmap to understand the scope and impact of our endeavor. Our matrix wasn't just a static document; it was a dynamic tool that fostered collaboration and alignment. By mapping out key milestones, dependencies, and outcomes, we painted a comprehensive picture of how our project intersected with the goals and objectives of other teams. Through interactive workshops and tailored presentations, we leveraged the matrix to engage stakeholders in meaningful conversations about the scale of our project and its implications for their areas of focus.

By illustrating how our success translated into opportunities for their teams to thrive, we garnered enthusiasm and support from across the organization. In the end, our relatable matrix served as more than just a planning tool; it was a catalyst for synergy and alignment, uniting teams behind a shared vision of success and propelling our project forward with confidence and momentum.
Running queries based on selected sellers for upcoming testing revealed something quite interesting. Sellers were engaging with repeat flows, predictable reports, and often never engaging with the platform outside of their typical reporting filters and groupings.

We identified areas for improvement, pinpointing where sellers faced hurdles or gaps in engagement. Armed with this knowledge, we tailored our strategies to address these pain points, ensuring a smoother, more seamless experience for all stakeholders involved. In essence, our journey through the data landscape wasn't just about crunching numbers—it was about illuminating pathways to success. By leveraging the power of information, we not only fine-tuned our rollout strategies but also fostered a culture of continuous improvement. And as we continue to harness the insights gleaned from our reporting platform, we're poised to navigate the ever-evolving business landscape with confidence and clarity.
Our solution addresses a spectrum of crucial needs for businesses, from understanding profit drivers to managing operations, gathering and acting on customer data, and meeting compliance requirements. With intuitive tools and data-driven insights, we empower users to optimize profitability, streamline operations, enhance customer engagement, and ensure compliance with confidence. From analyzing financial metrics to automating workflows, segmenting customer data, and generating compliance reports, our platform provides comprehensive solutions tailored to meet diverse business needs effectively.
React: Quick reactions are vital in sales. Data-savvy sellers swiftly adapt to market changes, customer preferences, and competitor moves, staying ahead with real-time insights.
Understand: Sellers dive deep into data-driven insights, decoding nuances, uncovering patterns, and shaping a comprehensive understanding of their audience and market trends.
Plan: Armed with insights, sellers strategize. Data guides decisions, from tailored strategies to resource allocation, forecasting trends, and charting a course towards success.
Enhancements across usability, navigation, customization, comparisons, education, and scalability. These improvements aimed to streamline user experience, simplify navigation, offer customization options, facilitate informed decision-making, provide educational resources, and support future growth. Through these updates, users can effectively navigate the platform, tailor it to their needs, and prepare for future scaling.
Our journey into refining the platform unveiled a trove of additional insights, particularly regarding the positioning of sellers within our matrix. Through meticulous analysis of post-testing data, we gained deeper clarity on the nuanced dynamics at play, shedding light on the factors influencing seller placement. These newfound insights not only enriched our understanding of seller behavior but also empowered us to fine-tune our matrix, ensuring it accurately reflects the evolving landscape of seller engagement. Armed with this knowledge, we are poised to optimize our strategies and better serve the diverse needs of our seller community.

In recognizing the inherent diversity among sellers, it becomes apparent why a one-size-fits-all approach to reporting tools falls short. Our post-testing analysis illuminated the intricacies of seller behavior and preferences, highlighting the need for tailored reporting solutions. Just as each seller occupies a unique position within our matrix, so too do they require reporting tools that align with their specific goals and challenges. Whether it's tracking performance metrics, monitoring inventory levels, or analyzing customer feedback, the varied needs of our sellers demand a versatile suite of reporting tools. By acknowledging and accommodating these differences, we can empower sellers to make informed decisions and drive their businesses forward effectively.

Placing sellers on the matrix was not merely about categorizing them; it served as a catalyst for uncovering intricate patterns across the ecosystem. As sellers found their designated positions, a fascinating tapestry of connections and correlations began to emerge. Through this process, we identified clusters of sellers exhibiting similar behaviors, preferences, and performance trends. These patterns provided invaluable insights into the underlying dynamics shaping the ecosystem, revealing hidden opportunities and potential areas for improvement. By discerning these patterns, we gained a deeper understanding of the interconnectedness of seller interactions and transactions within our platform. Armed with this knowledge, we are better equipped to tailor our strategies, optimize resource allocation, and foster a thriving ecosystem that benefits all stakeholders involved.

Cross-referencing seller positions on the matrix with feature requests proved to be a game-changer in our prioritization efforts. By aligning feature development with the identified patterns across the ecosystem, we gained invaluable context into the specific needs and pain points of different seller segments. For instance, sellers occupying similar positions on the matrix often shared common feature requests, indicating recurring challenges or desired functionalities within their respective clusters. This synergy between seller positioning and feature requests enabled us to prioritize development efforts effectively, ensuring that the most impactful enhancements were rolled out first. As a result, our approach to feature prioritization became more data-driven and targeted, ultimately leading to a more responsive and user-centric platform experience for all sellers.
Despite operating in different verticals, sellers often require similar tools to facilitate learning and growth within our platform. While their products or services may vary, their fundamental needs for insights, analytics, and resources remain consistent. By recognizing these commonalities, we can develop standardized tools and resources that cater to a broad range of sellers, regardless of their specific verticals. For example, features such as performance analytics dashboards, market trend reports, and educational webinars are valuable assets that can benefit sellers across various industries. By providing these universal tools for learning and improvement, we foster a collaborative environment where sellers can exchange knowledge, learn from each other's experiences, and collectively elevate their businesses to new heights.
In migrating our platform, preserving the previous experience is paramount. Seamlessly transitioning users ensures continuity, trust, and a smooth journey forward.

Offering a versatile repository for users' evolving needs. Whether you're a newcomer or a seasoned pro, our expanding collection ensures you always have the right resources at your fingertips.


Unlock the power of collaboration with our framework for library contributions. Seamlessly contribute your insights, resources, and expertise to enrich our ever-growing repository. Together, we build a knowledge hub.

Deliver a seamless journey across our ecosystem with a consistent experience. From platform to library, every interaction is intuitive, reliable, and tailored to your needs.

Whether you're on desktop, mobile, or utilizing specialized hardware, our platform adapts to your environment, ensuring a cohesive experience. Say goodbye to compatibility concerns and hello to versatility and accessibility.

Auditing the previous experience was a pivotal step in our product design journey, offering invaluable insights into our users' needs and pain points. Through meticulous examination of existing features, interfaces, and workflows, we gained a comprehensive understanding of the strengths and weaknesses of the previous iteration. This deep dive into the user experience provided a solid foundation upon which to build our redesign efforts, allowing us to identify areas for improvement and innovation. Armed with this knowledge, we embarked on a transformative journey to create a product that not only meets but exceeds the expectations of our users. The audit served as a guiding light, illuminating the path toward a more intuitive, efficient, and user-centric platform experience.

Mapping the seller journey across the rollout was a strategic imperative, guiding our efforts to deliver a seamless and impactful experience. By charting the path from onboarding to full utilization of the platform, we gained invaluable insights into the key touchpoints, pain points, and opportunities for enhancement. This holistic view empowered us to tailor our rollout strategies, ensuring that each step in the journey was purposeful and optimized for success. From initial engagement to ongoing support, our seller journey map served as a blueprint for delivering value and fostering long-term relationships with our users.

Our 24-user testing session proved to be a pivotal moment in our product development journey, uncovering critical revisions in copy, styling, and flow. Through hands-on engagement and real-time feedback, we gained invaluable insights into the user experience, identifying areas for improvement and optimization. From refining language to enhancing visual elements and streamlining navigation, every aspect of the product underwent careful scrutiny and iteration. The result? A more intuitive, engaging, and user-friendly platform that resonates with our target audience. By prioritizing user feedback and leveraging it to drive iterative improvements, we're not just building a product—we're crafting an experience that delights and empowers our users every step of the way.

The outcomes of our 24-user testing session were presented to the organization with a focus on actionable insights and tangible results. Through a comprehensive report and engaging presentation, we highlighted key findings, revisions, and their impact on the overall product development strategy. We emphasized the importance of user feedback in driving iterative improvements and showcased how revisions in copy, styling, and flow directly addressed user needs and preferences. Additionally, we provided recommendations for future testing and iteration, ensuring that the organization remained committed to delivering a user-centric product. By transparently sharing the outcomes of the testing session, we fostered alignment, collaboration, and a shared commitment to continuous improvement across the organization.
This centralized repository not only streamlines access to critical data but also empowers users to make informed decisions and drive business growth effectively. With the ecosystem reporting library at their fingertips, users are equipped to navigate the complexities of data analysis with confidence and clarity, propelling their success within our platform and beyond.
Each element was carefully designed to cater to different user preferences and reporting needs, ensuring versatility and effectiveness across various use cases. By incorporating intuitive navigation and visually compelling elements, I transformed raw data into actionable insights, empowering users to uncover patterns, trends, and opportunities with ease. Through iterative design processes and user feedback, I continuously refined and optimized these elements to deliver a seamless and visually impactful reporting experience for our users.
By simulating diverse user scenarios and interactions, I evaluated the performance and responsiveness of our touchpoints across different devices and environments. This comprehensive testing approach allowed us to identify and address potential scalability challenges early in the development process, ensuring a seamless experience for users regardless of the hardware they were using. By optimizing touchpoint scalability, we were able to enhance accessibility and usability, enabling users to engage with our platform effortlessly across a wide range of touchpoints and devices.

The modular system revolutionized the way users create dashboards, offering unparalleled flexibility and customization. By breaking down the dashboard-building process into modular components, users gained the freedom to mix and match elements according to their unique preferences and requirements. From data visualizations to performance metrics and KPIs, each module was designed to be easily draggable, resizable, and configurable, empowering users to create dashboards that truly reflect their individual needs and priorities. This modular approach not only streamlined the dashboard creation process but also fostered creativity and innovation, enabling users to experiment with different layouts and configurations until they found the perfect combination. With the modular system, users became the architects of their own dashboards, putting the power of customization firmly in their hands.

The tag and blade system introduced a game-changing approach to scalable tooling, controls, and filtering within our platform. By implementing a flexible tagging system, users could easily categorize and organize data, tools, and controls according to their specific needs and preferences. This intuitive system allowed for seamless filtering and sorting, empowering users to quickly locate the tools and controls they required for their tasks. Additionally, the blade system provided a modular framework for incorporating new features and functionalities into the platform. This modular approach enabled us to rapidly deploy updates and enhancements without disrupting the user experience, ensuring scalability and adaptability as the platform evolved. Overall, the tag and blade system served as the foundation for a robust, scalable, and user-friendly platform that could effortlessly accommodate the diverse needs of our growing user base.
Tags served as our primary control point and provided a quick path for accessing controls within our platform. By strategically assigning tags to various elements such as data, tools, and features, users could efficiently navigate and filter through the vast array of options available to them. This tagging system streamlined the user experience, allowing users to quickly locate and access the specific controls they needed for their tasks. Whether searching for data points, tools, or features, users could simply apply relevant tags to narrow down their options and find what they were looking for in a matter of seconds.
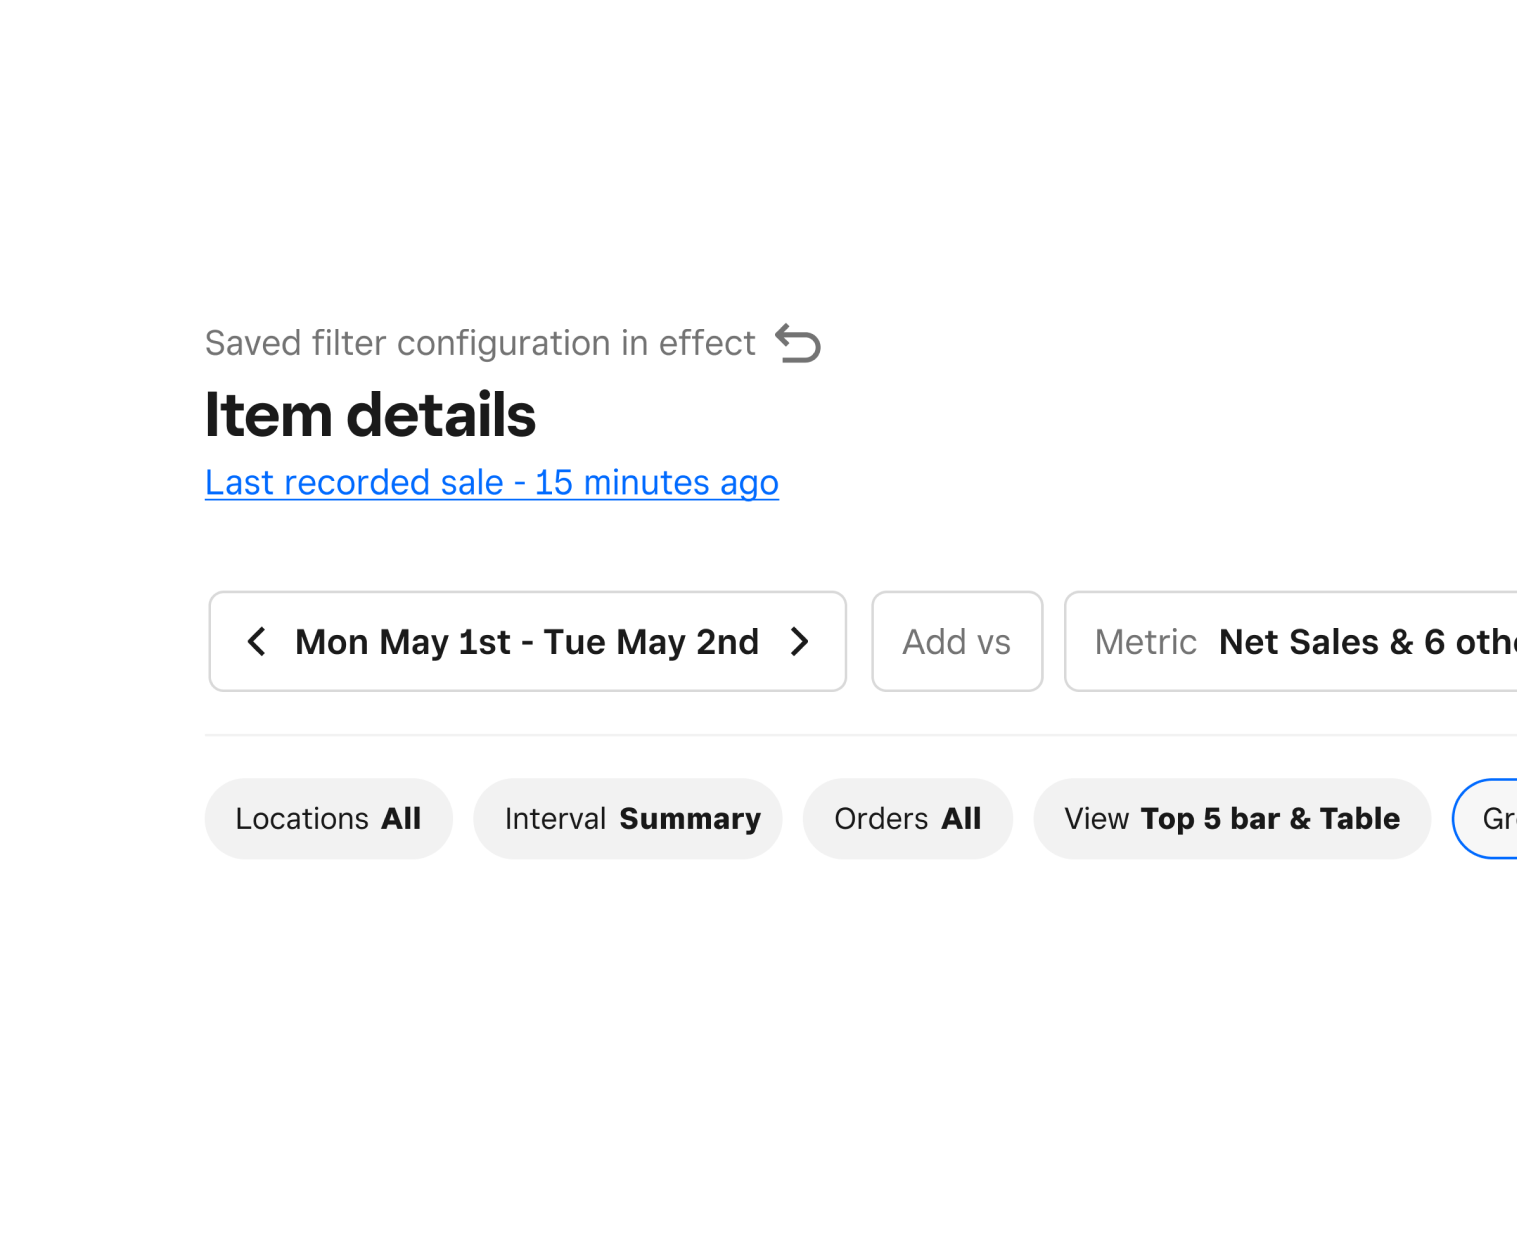
Acting as modular containers, blades provided a structured framework for housing and organizing these essential elements, ensuring a cohesive and intuitive user experience. Each blade could be customized and configured to accommodate specific controls, filters, or group-bys relevant to the user's workflow.


Every major iteration of our platform underwent rigorous testing before being integrated into the system, ensuring a seamless and reliable user experience.

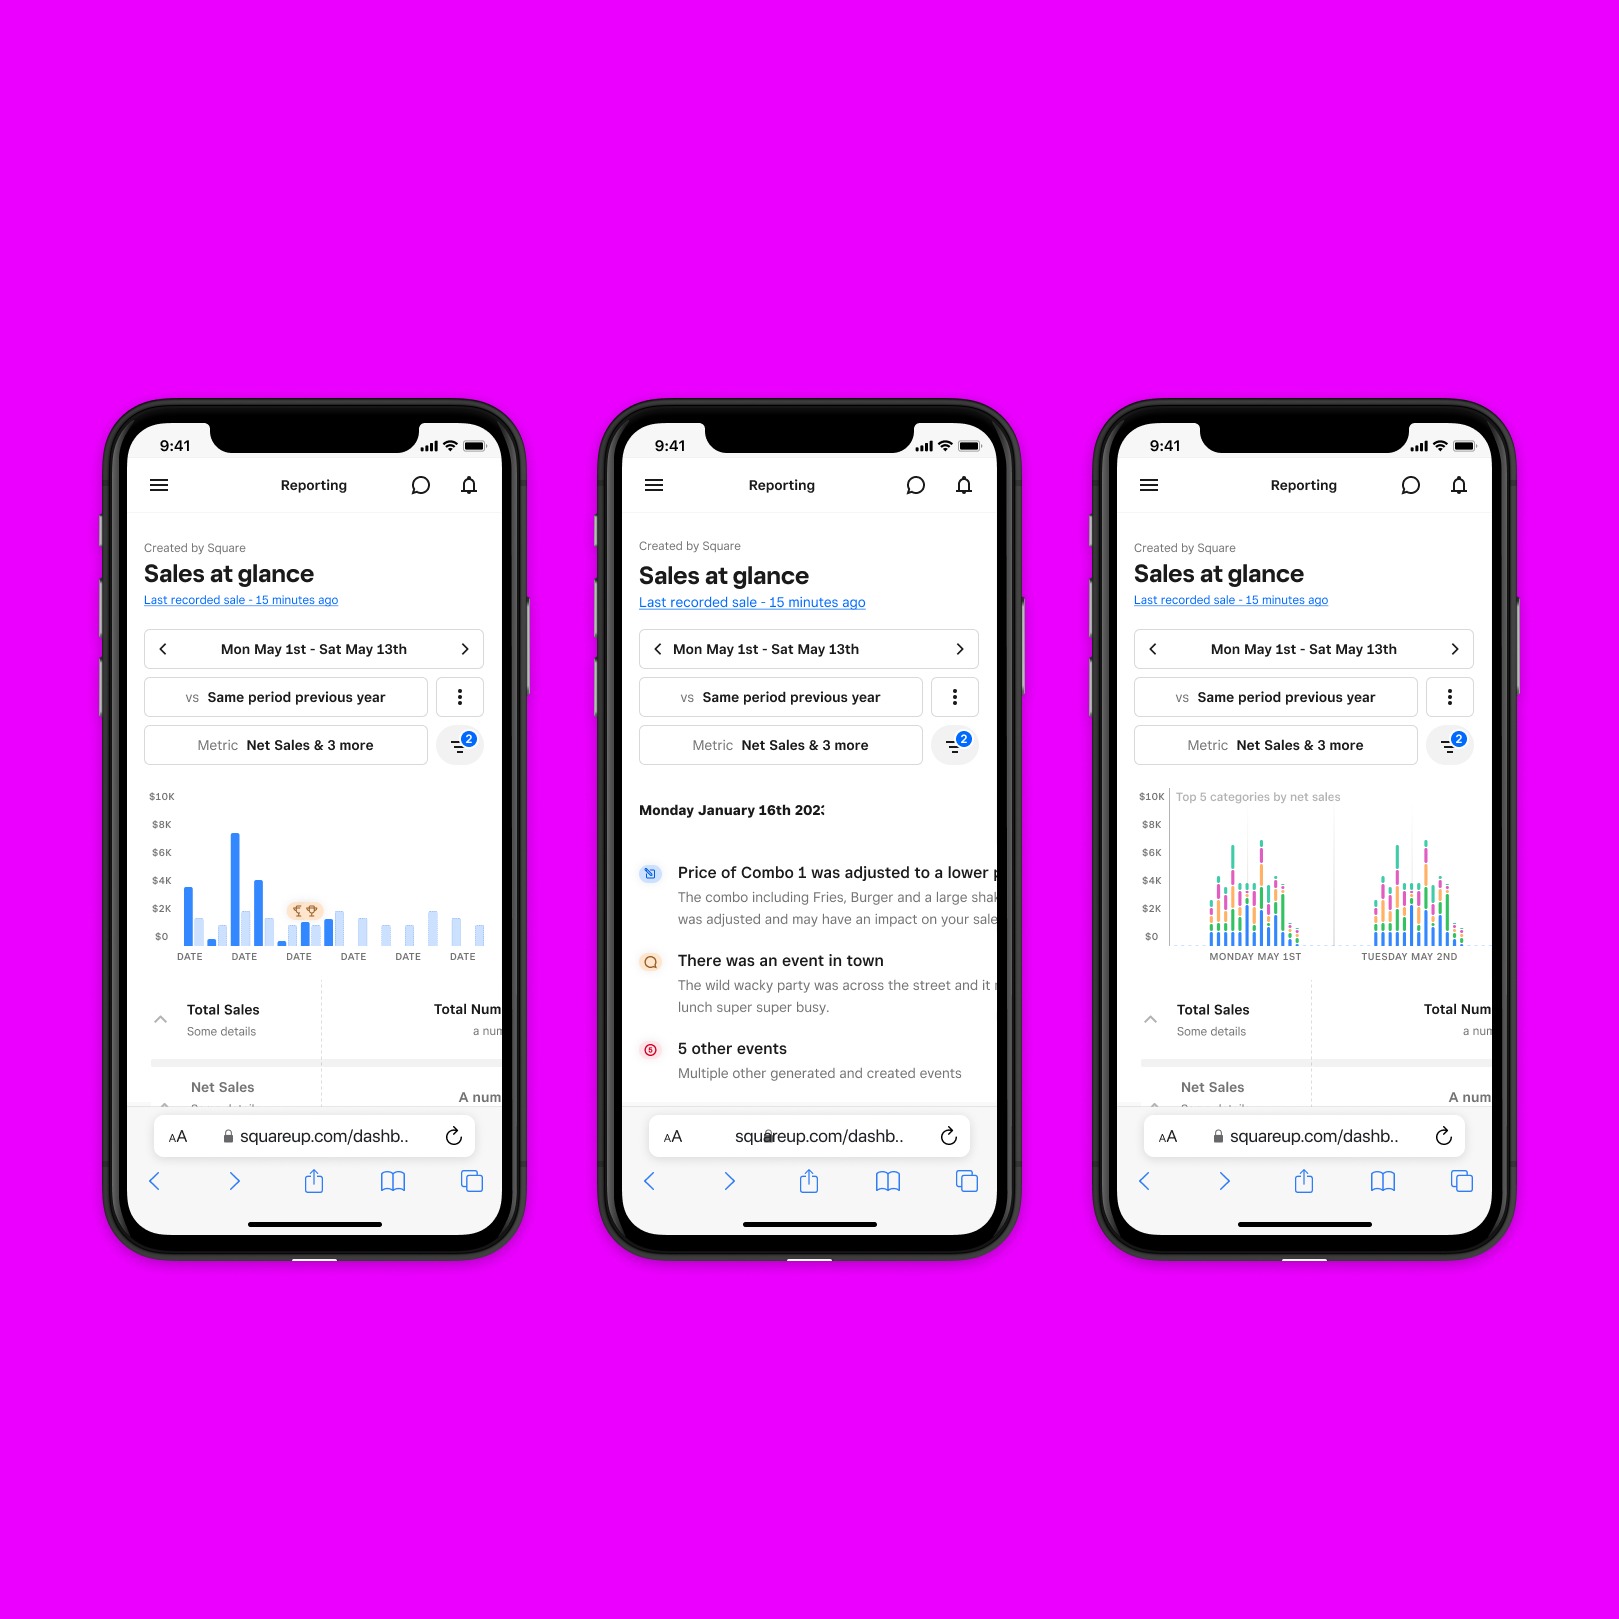
One of the key challenges in making data reporting work across screens is maintaining consistency and coherence in the user experience. Users should be able to seamlessly transition between different devices without encountering significant discrepancies in layout, functionality, or performance. Achieving this requires careful attention to detail and a cohesive design approach that prioritizes usability and accessibility across all screen sizes.


Approaching data reporting as a system of widgets and content allowed for a holistic and scalable solution to the challenges of designing for large and small screens. By breaking down the reporting interface into modular components or "widgets," each responsible for displaying a specific type of data or functionality, we achieved greater flexibility and adaptability across different screen sizes. These widgets could be arranged and customized according to user preferences, providing a tailored experience that maximized usability and efficiency.

Ensuring consistency across hardware and software was paramount in our approach to data reporting. By adopting standardized design principles and user interface guidelines, we aimed to create a cohesive experience that transcended device boundaries. Consistency in design elements such as color schemes, typography, iconography, and layout helped users seamlessly transition between different hardware platforms and software environments.
.png)

In addition to dashboard customization, our platform offers advanced data visualization options. Users can choose from a variety of chart types, including bar charts, line graphs, pie charts, and more.
.png)
Internal teams experienced a significant boost in efficiency and agility with the adoption of off-the-shelf components within our platform. By leveraging pre-built components and libraries, teams were able to expedite development timelines and reduce time-to-market for new features and functionalities. These off-the-shelf components provided a solid foundation for building upon, eliminating the need to reinvent the wheel for common UI elements and interactions.

At the heart of the framework was a centralized platform or repository where contributions could be submitted, reviewed, and managed. This platform served as a hub for collecting and organizing contributions from various sources, including internal teams, external partners, and community members.
The framework for contributions laid the foundation for a consistent experience across our platform, ensuring coherence and continuity across every square inch of our interface. By establishing clear guidelines and standards for contributions, we maintained consistency in design, functionality, and user experience throughout the platform's ecosystem.
Regardless of the platform, the framework emphasized consistency in design, functionality, and user experience. Contributions were evaluated based on their ability to maintain this consistency and enhance the overall platform experience, regardless of the user's chosen device or platform.
Businesses rely on the platform to track key performance indicators, monitor market trends, and identify opportunities for growth and optimization. From startups to multinational corporations, users are leveraging advanced analytics tools, customizable dashboards, and interactive visualizations to unlock actionable insights and drive strategic decision-making.
Whether tracking key performance indicators, analyzing market trends, or optimizing workflows, users are consistently engaging with the platform to unlock valuable insights and propel their businesses forward. This sustained growth in usage reflects not only the platform's effectiveness in meeting user needs but also its ongoing evolution and commitment to delivering innovative solutions in an ever-changing landscape.
From upmarket enterprises to mid-sized businesses, our platform has become a trusted ally, providing invaluable support and resources to help sellers maximize their potential and achieve success in today's competitive market. This milestone not only highlights the platform's impact but also reaffirms our commitment to empowering sellers of all sizes to succeed and thrive in an increasingly digital-first world.


.png)


.png)
Our achievements are the result of collaborative efforts across teams, stakeholders, and users. By fostering a culture of collaboration, open communication, and shared ownership, we've been able to harness the collective expertise and insights of our community to drive innovation and achieve our goals.

Our success is driven by prioritizing the needs and preferences of our users. By continually listening to feedback, iterating on features, and enhancing usability, we've created a platform that resonates with our users and drives engagement.

By providing users with the freedom to personalize their experience according to their unique needs and preferences, we empower them to tailor the platform to suit their workflows without overwhelming complexity. Our approach to customization is guided by intuitive design principles, ensuring that even the most advanced features remain accessible and easy to use.

Our ability to adapt quickly to changing market dynamics and user demands has been instrumental in our success. Embracing agility in development processes and decision-making has allowed us to stay ahead of the curve and deliver value to our users efficiently.
.png)